

Support and resistance are core principles of price action analysis, acting as a important elements in technical analysis that help traders to identify key price zones where buying & selling pressure consistently appears. These zones represent areas where the equilibrium between demand & supply changes, and leading prices to pause, rebound, or reverse direction. Such zones work as important technical & psychological barriers, helping traders to identify potential entry points, exit levels, and risk management areas. Support acts as a price “floor” where buying pressure increases, and stopping prices from falling further, while resistance acts as a “Celling” where selling pressure rises and restricts upward movement. Such levels do not appear randomly; they are created when market participants consistently react to certain price areas shaped by historical price behavior, collective beliefs and trader psychology. The concept of support and resistance is universal and works across all financial instruments such as stocks, cryptocurrencies, commodities, and other traded markets.
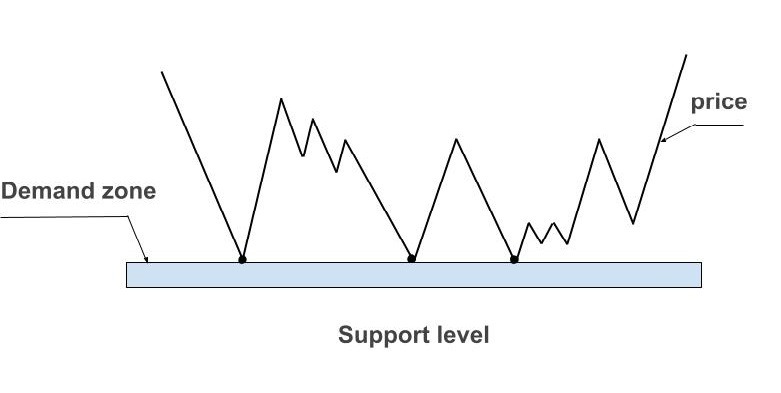
Support level
Support is a price area where selling pressure weakens and instruments may start moving higher. This zone marks a price area where buying strength overcomes selling pressure, and stopping the price from falling further. When demand rises around support levels, prices often hold or bounce back, and highlighting support zones as attractive buying areas for traders anticipating an upward continuation or reversal.
Resistance level
A resistance level is a price zone at which financial instruments such as stocks, currencies, or indices tend to face selling pressure, causing the upward price movement to slow down or temporarily stop. At this level, sellers becomes more active, creating an upper boundary that makes it difficult for prices to move higher. As a result, the price may consolidate, reverse, or move downward from this zone. Many traders consider resistance zones as potential sell points when the price struggle to break above these levels.
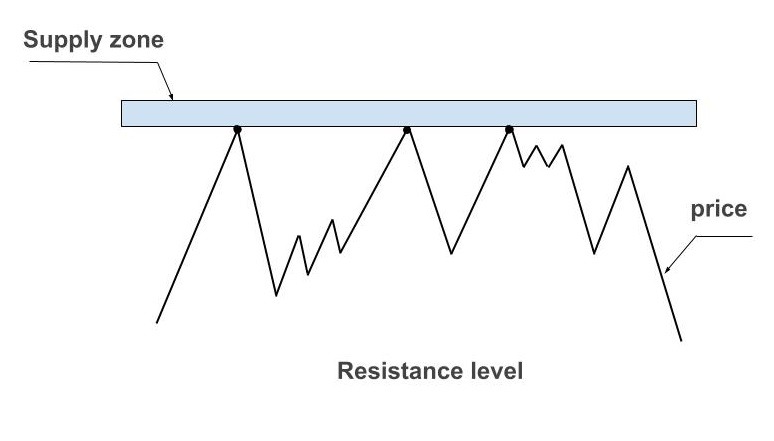
Support and resistance should be viewed as price zones rather than precise lines, as markets rarely reverse from an exact level. Because of market volatility, stop loss hunting, liquidity absorption, and short term emotional trading, prices temporarily penetrate above or below these areas. This is why skilled traders focus on how price behaves inside these zones, watching for rejection, consolidation, or reversal patterns instead of looking for an immediate reversal from a single level.
A key idea in support and resistance analysis is role reversal, where a broken support level acts as new resistance, and a broken resistance level works as support. When price falls below a support zone, traders who bought near that level often sell on a retest, creating supply and turning the old support area into resistance. When price breaks through resistance, sellers who entered at higher prices may close their trades on pullbacks, and creating demand that shifts resistance into support.
Analyzing the causes that create support & resistance levels
To understand the concept of support and resistance, it is essential to first understand the principle of supply and demand. Price movement in the market is driven by the actions of buyers and sellers. Strong buying pressure usually drives prices higher, whereas stronger selling pressure results in a decline in prices. This establishes a clear relationship between price and demand, as higher demand lifts prices and lower demand causes prices to fall.
Support and resistance levels emerge from this ongoing battle between buyers and sellers. These levels represent areas where market participants collectively react in a similar manner. A support zone is a price range where buyers actively enter the market, believing prices are more likely to rise than fall. On the other hand, resistance zones emerge when higher prices attract more sellers, increasing supply & creating pressure for a potential downside move. Thus, support & resistance zones represent the collective psychology of market participants, shaped by repeated buying and selling at particular price levels.
How to identify support & resistance levels
There are several effective methods used by traders to identify support and resistance levels on price charts. These includes trendline analysis, where ascending trendlines signal support in bullish trends and descending trendlines signal resistance in bearish trends. Moving averages act as dynamic support & resistance zones, with price behavior commonly influenced by near these levels. Strong buying or selling activity is commonly observed at psychological levels such as round numbers and past price zones, turning them into important support and resistance areas.
Trendlines analysis
A trendline is a widely used technical analysis tool that helps traders to identify and predict the direction of price movement on a chart. It is applicable across all types of securities, including stocks, indices, commodities, and currencies. A trendline is generally drawn by connecting at least two significant price points; however, most traders believe that a trendline formed by three or more price touches is more reliable and stronger than one drawn using only two points, as it better confirms the underlying trend and potential support or resistance zones.
A trend line is a straight line that connect two or more significant price points and can be extended into the future to act as dynamic support or resistance. The more times upward and downward trend line is tested without being broken, the stronger and more reliable the trend line is considered. A decisive break of a trend line often signals a potential change in the prevailing market trend. Examples are:
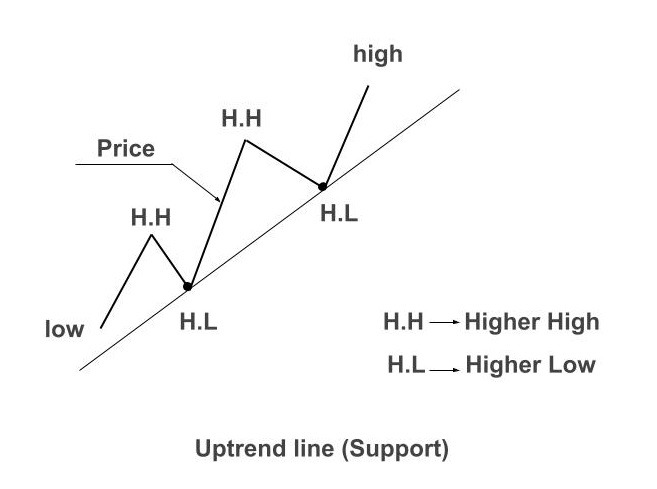
A) Uptrend line
An uptrend line has a positive upward slope and is formed by connecting two or more significant low points on a price chart. It is drawn by joining the swing lows, where each subsequent low is higher than the previous one. This condition is essential for the trend line to maintain a positive slope and confirm the presence of an uptrend. The uptrend line acts as a support zone, as prices often react near this line and tend to bounce back upward after touching it, indicating continued buying interest at higher levels.
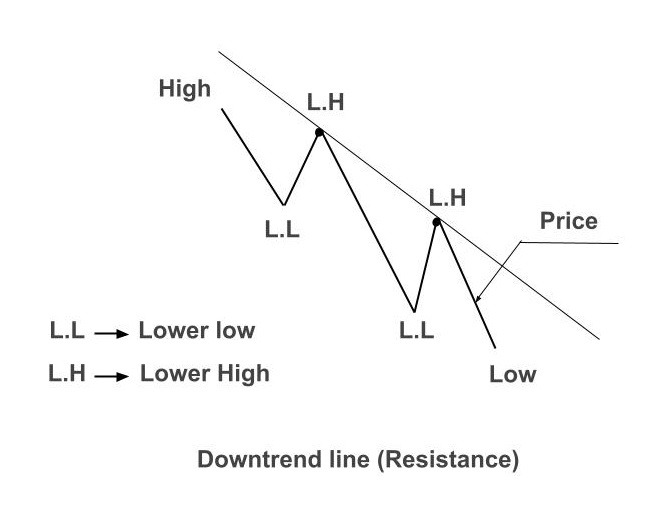
b) Downtrend line:
A downtrend line has a negative slope and is formed by connecting two or more successive lower high points on the price chart. This line represents the prevailing bearish trend in the market. A downtrend line acts as a dynamic resistance zone, where prices often face selling pressure. When the price approaches the downtrend line, it may fail to break above it and fall back, reinforcing the resistance. For a valid negative slope, each subsequent high must be lower than the previous high, confirming the strength of the downtrend.
Moving average as a support and resistance
Moving averages acts as dynamic support and resistance zones, as they change with price over time. For example, traders and investors widely follow the 200 day SMA as an important market level. The 200 SMA often acts as a key dynamic support during uptrends, where buyers step in and push prices higher, but during downtrends, it flips to a resistance level, limiting rallies as sellers dominate. Due to their dynamic behavior, moving averages are useful for spotting potential support and resistance zones rather than precise price points.
Psychological levels as a support & resistance
In a large number of securities, a common & universally observed form of support & resistance is known as psychological levels, these levels are typically round numbers such as 10, 20, 50, 100, 200, and 500. Such round number act as psychological reference points where many traders tend to place buy or sell orders. As a result, price often reacts near these levels, causing them to behave as potential support or resistance zones.
FAQ’S
Answer: Support and resistance in the stock market mean price levels where a stock usually stops going down (Support) or stops going up (Resistance), making it easier for beginners to decide when to buy or sell.
Answer: Support and resistance lines are exact price points where price stops or reverses, while support and resistance zones are wider price areas where the price often reacts, making zones more reliable and easier to use in real market conditions.
Answer: Support and resistance lines are drawn by connecting multiple price lows (Support) and highs (Resistance) on a stock chart to identify key levels where price historically tends to reverse, pause, or break out, helping traders plan better entry & exit points.
Answer: Yes, a support or resistance level becomes stronger when it is tested many times, because the price repeatedly respects that level, showing strong buying or selling interest there.
Answer: Yes, support can turn into resistance and resistance can turn into support when the price breaks a level, because traders start buying or selling differently at the same price zone.
Disclaimer
This article is for educational and informational purposes only and should not be considered financial, investment, trading, legal, or tax advice. Cryptocurrency, blockchain, stock markets, and other financial investments involve risks. Always conduct your own research and consult a qualified financial advisor before making any investment decisions.