

Price action trading is a trading strategy that focuses on price movements, chart patterns, support & resistance levels, and candlestick formations to understand market sentiment and anticipate future price movements. In this approach, a traders decision making is based on primarily the historical movement of price over time, rather than depending on other technical analysis methods that heavily depend on complex indicator systems to predict future price direction.
In price action trading, traders use clean, uncluttered charts often known as “Naked Charts”. Traders primarily use candlestick charts because they clearly show OHLC data and reveal momentum as well as market rejection. The structure of candles, including their size, wicks, and closing levels, reveals important information about market strength or weakness. Large bullish candles reflect strong buyer momentum, whereas large bearish candles signal seller control. Small candles usually signal market indecision or a consolidation phase before a significant price move.
Market structure is a key element of price action trading, helping traders to recognize uptrends through higher highs and higher lows, and downtrends through lower highs and lower lows. Consolidation between strong levels reflects a range bound market. Price action patterns emerge from recurring human behaviours in the market, where formations like pin bars, engulfing candles, inside bars, and breakout pullback setups show changing buyer and seller dominance.
Price action trading is built on three fundamental belief that form the theoretical foundation of the methodology and shape how traders read and interpret market behaviour. The three fundamental beliefs of price action trading are:
- Market discounts everything
- Price moves in trends
- History tends to repeat itself
A) Market discounts everything
The first and most important assumption of price action trading is that the market discounts everything. This means that the current market price already reflects all available information, this includes economic data, corporate fundamentals, earnings reports, interest rates, geopolitical factors, and market emotions like fear and greed.
B) Price moves in trends
The second core idea of price action trading is that price moves in trends & markets typically flow upward, downward, or sideways, and these movements often continue rather than change direction abruptly.
C) History tends to repeat itself
According to the third assumption of price action trading, markets tend to repeat historical patterns because traders psychology remains similar across different periods.
Different techniques used to identify price action while trading
The following are several key techniques used by traders to identify price action while trading:-
Support and resistance levels
Support and resistance are key price levels used in price action trading to identify areas where the market is likely to pause, reverse, or change its current trend. These levels represent important zones of demand and supply and play an important role in anticipating future breakouts, pullbacks, or reversals.
Support zone
A support zone is a price area where a security tends to stop falling due to increased buying interest. At this level, the price often stabilizes and attempts to bounce back in an upward direction.
Resistance zone
A resistance zone is a price area where a security faces strong selling pressure. As a result, the price usually struggles to rise further and may either pause, reverse downward or consolidate before making another move.
Trendlines
Trendlines are simple but powerful tools used in price action trading to analyze price movement and identify market trends. A trendline is a straight lines drawn on a price chart by connecting two or more significant price points. It helps traders to visually understand the markets direction, whether the price is moving in an uptrend, downtrend or sideways trend.
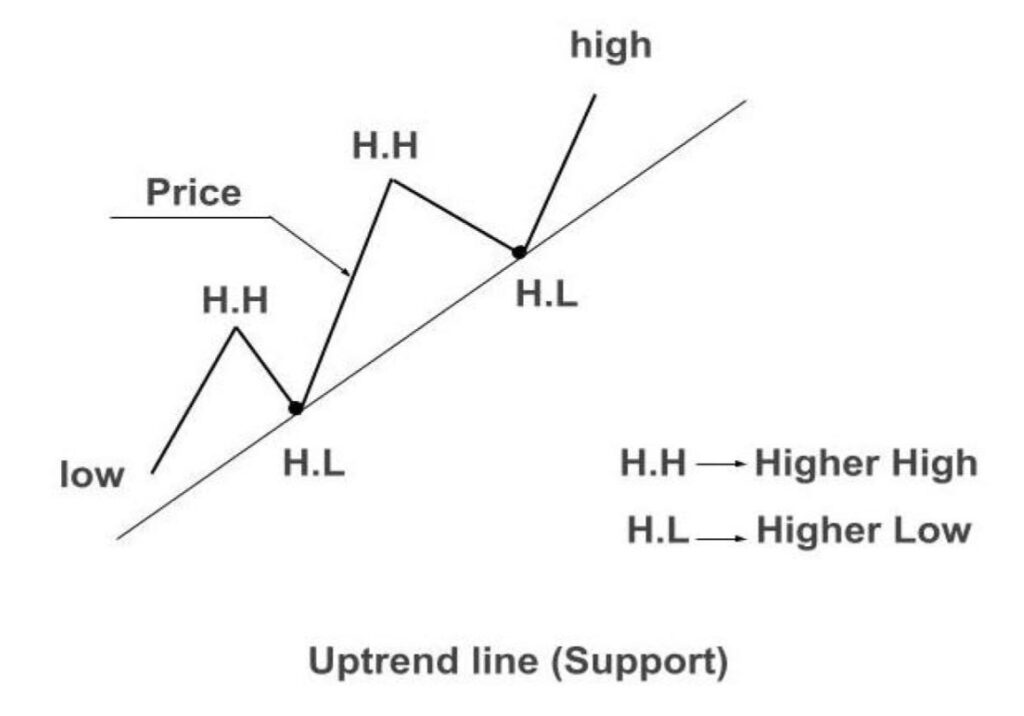
Uptrend
An uptrend is formed in a bullish market and it represented by connecting successive higher lows. This trendline also acts as a support level, indicating buying strength in the market.
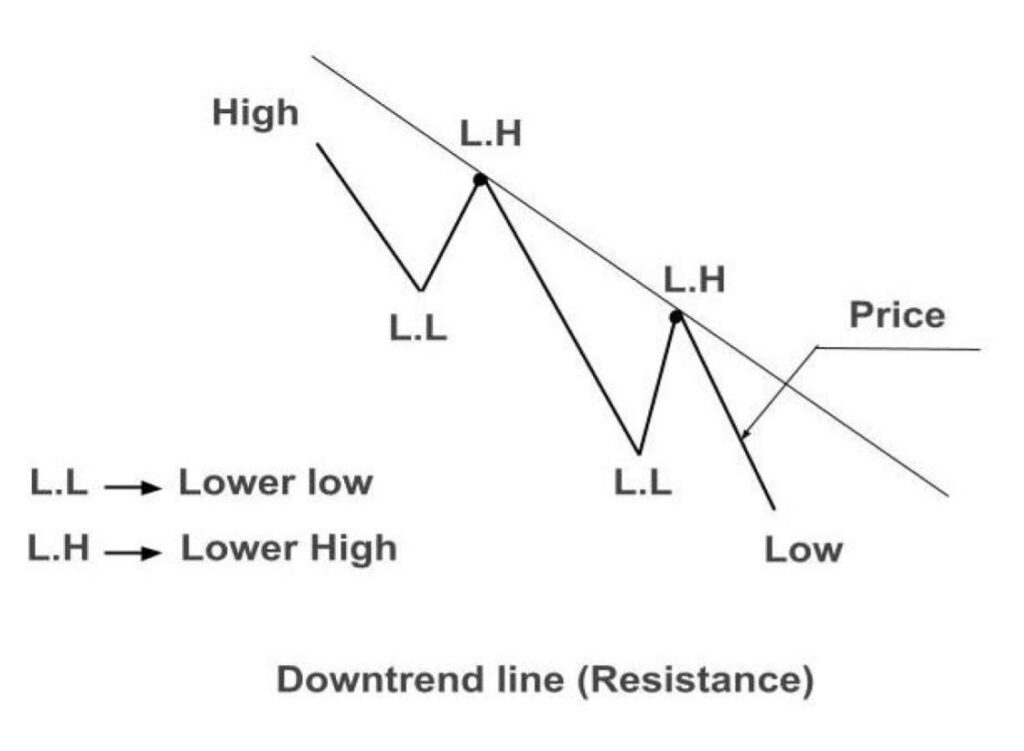
Downtrend
A downtrend is formed in a bearish market and it represented by connecting successive lower highs. This trendline acts as a resistance level, showing selling pressure when sellers dominate the market.
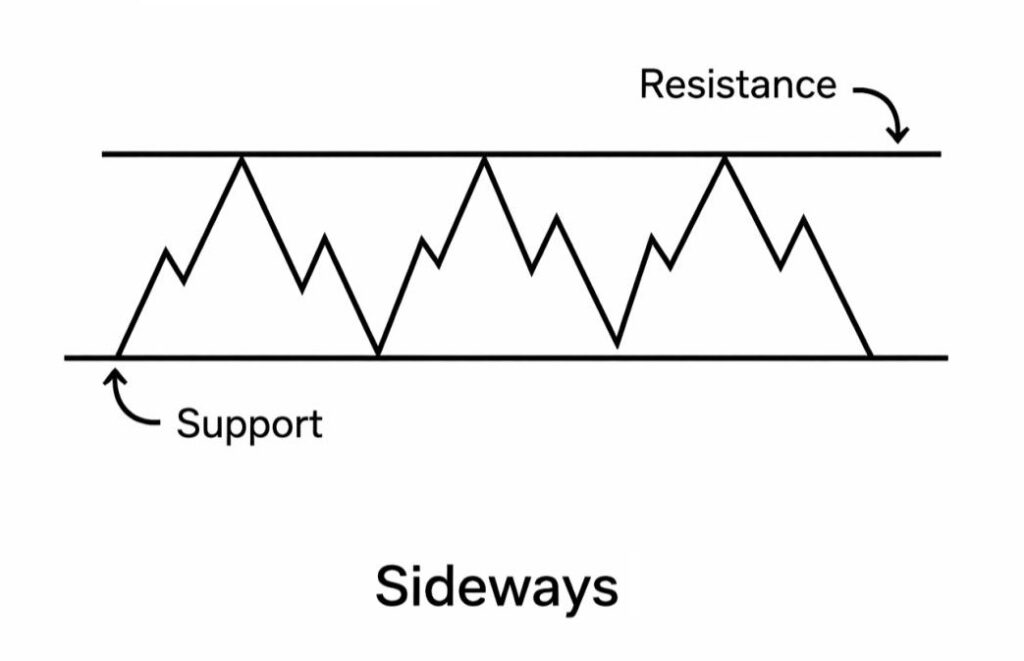
Sideways
A sideways trend happens when an assets price fluctuates between defined support and resistance levels, showing no strong bullish or bearish direction and reflecting market indecision.
Price channels
A price channel is formed when price moves between two parallel trendlines. One trendline is drawn by connecting swing highs, while the other is drawn by connecting swing lows. The upper trendline, created from swing highs, acts as a resistance level, whereas the lower trendline, created from swing lows, acts as a support level. By visualizing price channels, traders can identify potential buying and selling opportunities and anticipate futures price movements based on price behaviour within the channel. The following are the main types of price channels:
- Ascending channel
- Descending channel
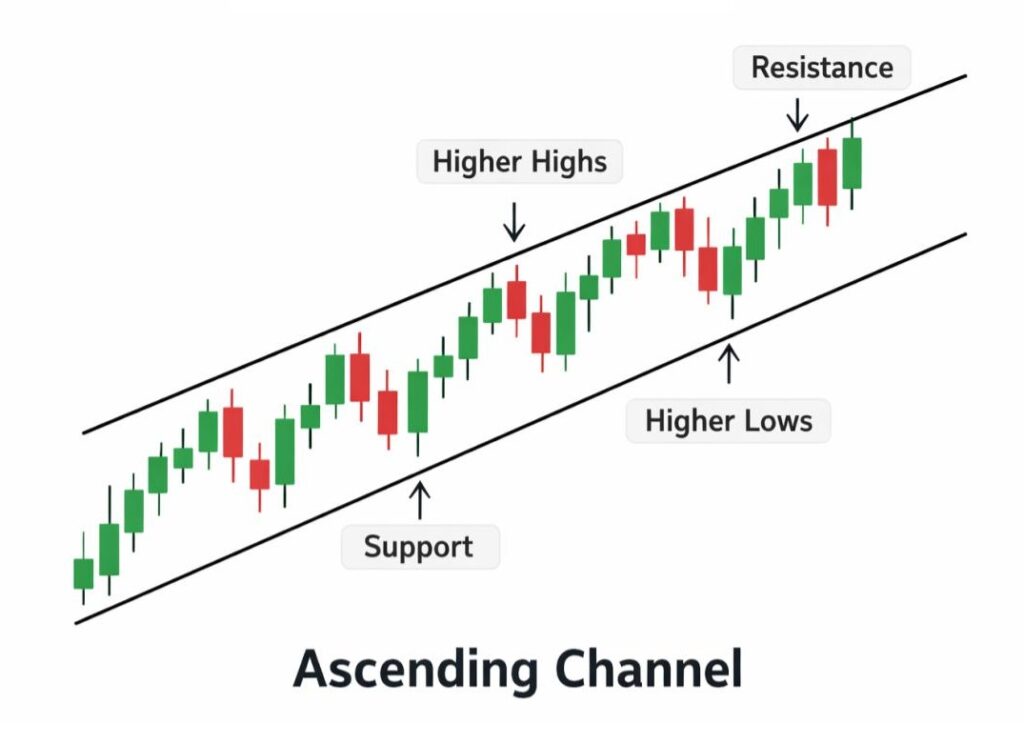
Ascending channel
An ascending channel indicates bullish momentum, where both trendlines slope upward. In this structure, price consistently forms higher highs and higher lows, showing strong buying pressure and an ongoing uptrend.
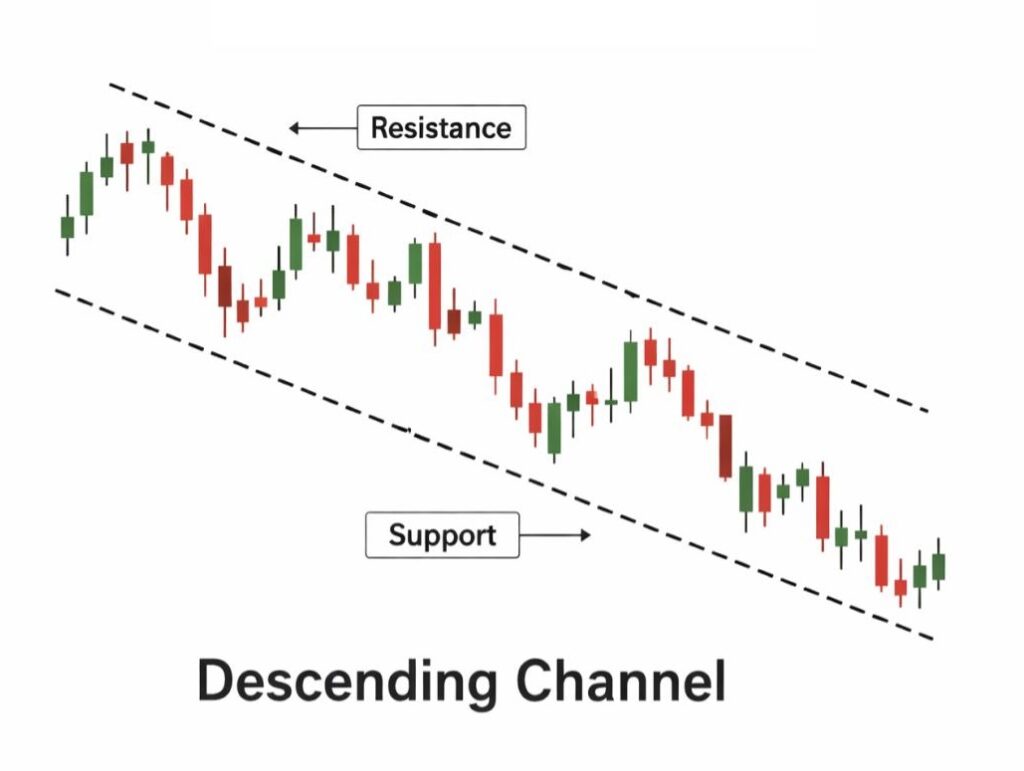
Descending channel
A descending channel indicates bearish momentum, where both trendlines slope downward. In this structure, price forms lower highs and lower lows, reflecting strong selling pressure and a continuing downtrend.
Candlestick pattern analysis
Candlestick pattern analysis is a price action technique that interprets and reads the shapes and arrangements of candlesticks, which visually represent open, high, low and close (OHLC) data over specific time frames. Patterns such as pin bar, Doji, engulfing, etc., help traders to understand market sentiment and potential price movement.
Pin bar
A pin bar indicates a sharp rejection of price at a particular level, suggesting a potential price reversal. It consists of a small real body and a long wick (shadow). A long upper wick signals rejection of higher prices and may indicates a bearish reversal. A long lower wick signals rejection of lower prices and may indicate a bullish reversal. Pin bars are more reliable when they appear at key support and resistance levels.
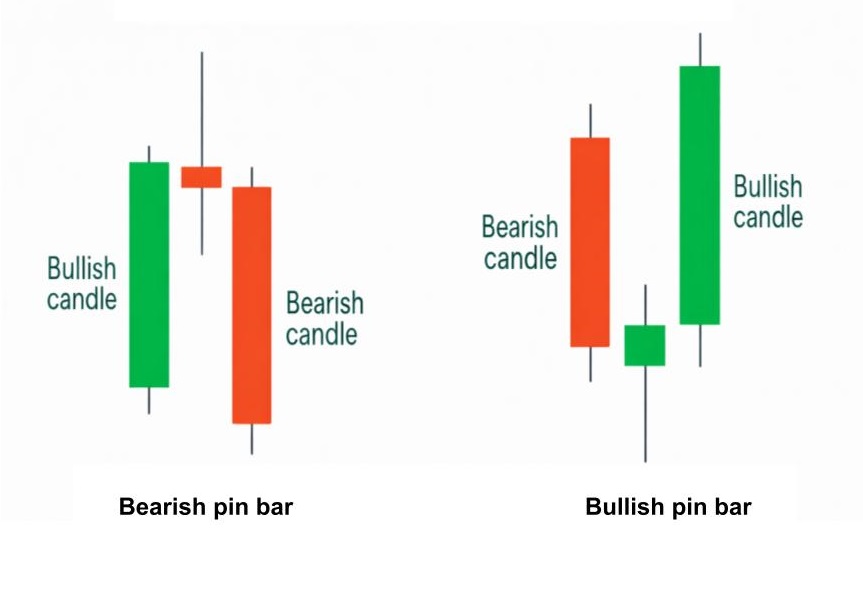
Chart pattern analysis
Chart pattern analysis is a technique used by traders to study historical price charts and identify recurring shapes and formations in order to predict future market trends. Head and shoulders, double top and double bottom etc. are examples of chart patterns.
Conclusion
Price action trading is a reliable and effective method that enables traders to interpret market behaviour by analyzing pure price movements. By analyzing higher highs and higher lows in uptrends, as well as lower highs and lower lows in downtrends, traders can clearly identify the prevailing market direction.
Price action trading also helps traders identify important support and resistance levels where market buying and selling pressure has shifted in the past. Such levels indicate important areas of market focus, helping traders to trade with greater confidence and discipline without excessive dependence on indicators.
Price action trading demands patience, consistent practice, and strong emotional discipline. Understanding price movements can be challenging for beginners since chart reading skills develop with practice and experience. Traders must also develop control over emotions like fear, greed, and over confidence, since price action trading requires decisions to be made in real time market conditions.
Understanding market psychology through direct price movement is the foundation of price action trading. Through consistent practice and discipline risk management, price action trading becomes a powerful and enduring trading methodology.
FAQ’S
Answer: Price action trading is a simple trading method where traders make decisions by observing price movement on charts without using indicators.
Answer: Price action focuses on analyzing raw price movements and chart patterns without indicators, while technical indicators use mathematical calculations like RSI, MACD, or moving averages to generate trading signals and confirm trends.
Answer: Price action trading mainly uses candlestick charts, support and resistance levels, trendlines, chart patterns, volume analysis, and price action indicators to analyze market movement without depending on complex indicators.
Answer: The core components of price action analysis include price movement, candlestick patterns, support and resistance levels, market structure (Trend), and trading volume, which help traders understand market behavior without indicators.
Answer: Higher highs and higher lows in price action trading mean the price is moving upward by making new peaks higher than the last ones and new pullbacks higher than previous lows, which shows a clear uptrend and strong buying strength in the market.
Answer: The most common price action patterns include support and resistance, trendlines, double top and double bottom, head and shoulders, and candlestick patterns, which traders use to understand market direction and make better trading decisions.
Answer: There is no single ideal indicator for price action, because price action trading mainly focuses on reading price movement, candlestick patterns, and support/resistance levels directly from the chart.
Answer: Price action trading has limitations such as subjective interpretation of charts, lack of clear buy/sell signals for beginners, and reduced accuracy in low volume or highly volatile market conditions.
Disclaimer
This article is for educational and informational purposes only and should not be considered financial, investment, trading, legal, or tax advice. Cryptocurrency, blockchain, stock markets, and other financial investments involve risks. Always conduct your own research and consult a qualified financial advisor before making any investment decisions.