

Technical analysis is the art of forecasting future price movements by analyzing past price data and understanding the forces of supply and demand reflected in market prices. By studying historical price movements and trading volume, traders attempt to estimate the probable direction of stocks, commodities, and other financial instruments, which helps in making informed trading decisions. Technical analysis visually presents market information like price movements and trading volume through charts. By applying various chart patterns and technical indicators to these charts, traders can identify trends and anticipate potential future price movements.
Technical analysis is a powerful tool that not only helps in identifying entry and exit points but also assists traders in maximizing profits and minimizing losses through effective risk management. Momentum oscillators and volume based indicators are used to evaluate the strength or weakness of a price move. Such understanding helps traders stay away from false breakouts and focus on high profitability trade setups.
Another significant importance of technical analysis is that it helps traders to follow standardized strategies. By using predefined rules based on charts and indicators, traders can create repeatable strategies that reduce guesswork. Such a systematic method helps in performance evaluation, gradual strategy improvement and maintaining consistency across changing market phases.
Technical analysis helps forecast future price movements by studying past market behaviour. Because human behaviour in the markets remains consistent, analyzing historical price movements helps forecast potential future trends. This does not ensure results, but it greatly enhances the probability of making better decisions.
There are two most common methods used to identify market trends in technical analysis:
- Candlestick patterns and chart patterns
- Technical indicators
Candlestick patterns and chart patterns
Candlestick charting is one of the most commonly used methods for representing price movements on a chart. It displays the open, high, low and close prices in a simple visual format, making it easier for traders to understand market behaviour and price action.
Candlestick patterns are formed either by a single candlestick or by a group of two or more candlesticks. These patterns help traders to analyze market sentiment and anticipate potential movements. By studying candlestick formations, traders can identify buying and selling pressure present in the market.
Chart patterns are visual representations of price movements over a specific period of time. They reflect the collective psychology of market participants and help traders to understand trend behaviour. Chart patterns play a important role in predicting trend reversals as well as trend continuation, making them an essential part of technical analysis.
Candlestick patterns are broadly classified into the following types:
- Bullish and bearish candlestick patterns
- Doji candlestick patterns
Bullish and bearish candlestick patterns
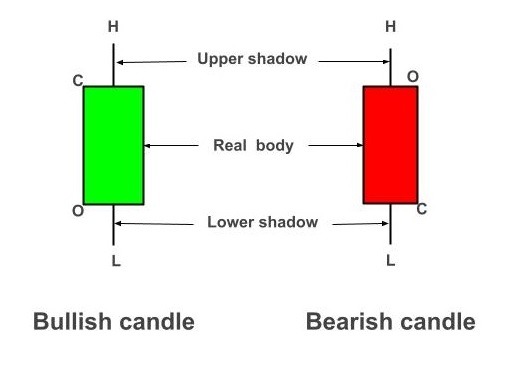
Where,
C ⇒ Close Price
O ⇒ Open Price
H ⇒ High
L ⇒ Low
Doji candlestick patterns
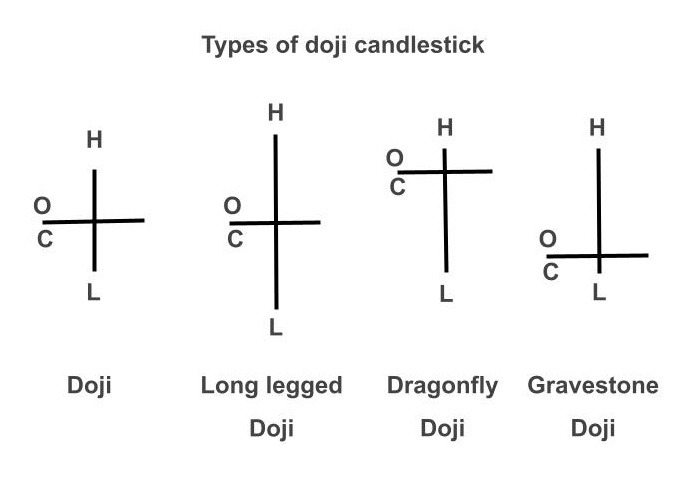
Where,
C ⇒ Close Price
O ⇒ Open Price
H ⇒ High
L ⇒ Low
Common chart patterns are
Head and shoulders
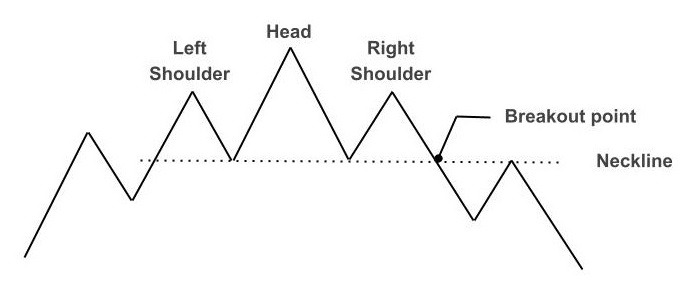
Double top/bottom
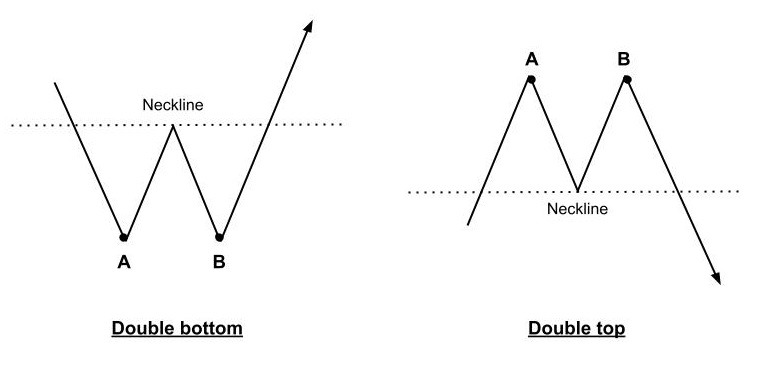
Chart common types are
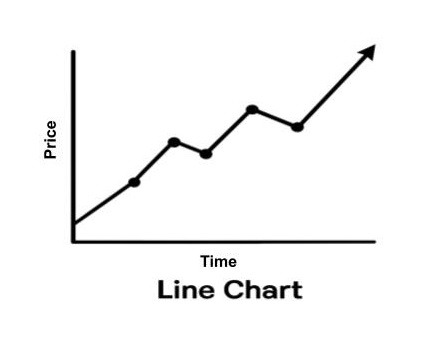
Line chart
A line chart is one of the simplest and most commonly used stock market charts, plotting price movement by connecting closing prices over a given time period with an unbroken line. Traders and investors use it to determine whether the market is trending up, down, or staying flat. Line charts provide a clean and straightforward view, making them ideal for identifying long term market movements.
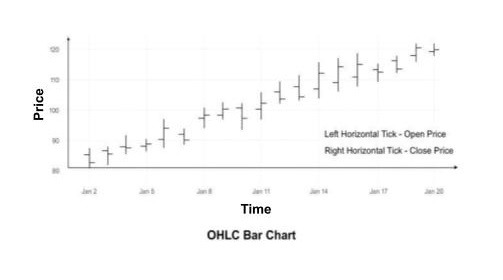
Bar chart
A bar chart is a price charting method that helps traders analyze market behaviour by showing OHLC prices for a particular time period. Every bar reflects one specific time period, showing the price range from high to low through the vertical line, while the horizontal ticks display the open and close prices.
Candlestick chart
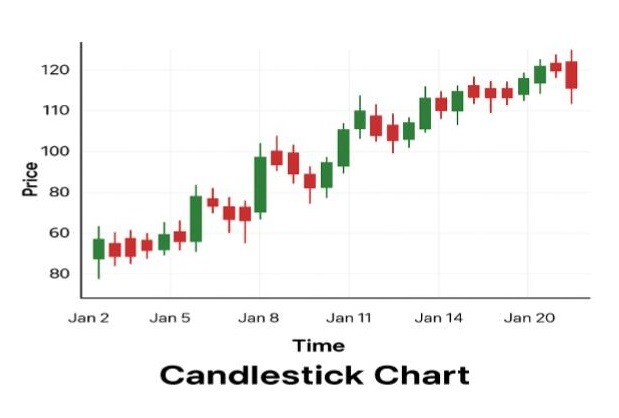
A candlestick chart is one of the most commonly used charts in technical analysis, showing a securities open, high, low, & close prices for a given time period. A single candlestick captures trader sentiment, showing open & close levels in its body and upper & lower wicks that record market highs & lows. Candlestick charts allow traders to easily interpret market sentiment, detect price trends, and identify possible reversals, making them a crucial tool for stock market analysis.
Technical indicators
Technical indicators provide the practical base of technical analysis by turning raw market information into structured and readable signals. The entire conclusion of technical analysis is based on price movement and volume data. All tools and techniques of technical analysis depend on five key elements, namely open, high, low, close (OHLC), and volume. Technical indicators are derived from mathematical calculations applied to price and volume data, which help traders to identify market trends, market behaviour, momentum, and detect overbought or oversold conditions, overall market conditions.
Fundamental analysis considers financial statements and broader economic factors, but technical indicators depend strictly on past market data. The core belief behind indicators is that price action reflects all known information, and patterns tend to repeat due to market psychology. Technical indicators fundamentally depend on the idea that price behaviour in the market is not random. Market prices tend to move in trends, repeat certain patterns, and react similarly under comparable conditions due to collective market psychology.
The following are the key reasons for using indicators in technical analysis
- Technical indicators help traders visually identify the price direction and trend of a security.
- They confirm the strength of the trend and help validate whether the existing trend is likely to continue.
- Indicators assist in identifying potential trend reversals; for example, the relative strength index (RSI) highlights overbought and oversold conditions, aiding in timely entry and exit decisions.
- Indicators help in identifying important support and resistance levels, which are crucial for planning trades.
- Indicators such as the average true range (ATR) are useful for setting stop loss levels and managing risk by limiting potential losses.
Moving average
A moving average is one of the most common and widely used trend following indicators in technical analysis. It calculates the average price of a stock over a specific time period. The primary characteristic of a moving average is that it helps traders identify the direction of price movement while reducing the impact of short term price volatility. there are two main types:
- Simple moving average (SMA)
- Exponential moving average (EMA)
Simple moving average (S.M.A)
The simple moving average calculates the average price of a security over a specified number of periods by giving equal weight to each price value.
Formula:
S.M.A = (x1 ᐩ x2 ᐩx3+ – – – xn) / p
Where:
x = Price of the security
p = Total number of time periods
Exponential moving average (EMA)
The exponential moving average assigns greater weight to recent price data, making it more responsive to current price movements compared to the simple moving average. Due to this responsiveness, EMA is often preferred by traders for short term trading and momentum analysis.
Relative strength index (RSI)
Relative strength index (RSI) is a powerful momentum oscillator that measures the speed and change of price movements. It oscillates within a range of 0 to 100 and is widely used by traders to identify overbought and oversold market conditions.
Support and resistance
A) Support
Support is a price level at which a security such as a stock, commodity, or currency tends to stop falling and may bounce back upward. At this level, buying interest is strong enough to overcome selling pressure, making it an important area for traders to observe potential trend reversals or price stabilization.
B) Resistance
Resistance is a price level at which security tends to stop rising and may begin a downward movement. At this level, selling pressure increases, often preventing the price from moving higher and signaling a possible reversal or pause in the upward trend.
Volume analysis
Volume indicates the number of shares traded during a given period and is used to confirm the strength of price movements. When volume rises during an uptrend, it reflects strong buying interest among traders. However, if volume starts declining, it suggests a lack of participation and weakening interest in the trend.
Conclusion
Technical analysis is a powerful tool used by traders and investors to understand market trends and make informed investment decisions by studying historical price movements and chart patterns. It is widely applicable to both short term trading and long term investing, helping market participants identify potential entry and exit points. However, the success of technical analysis depends on a disciplined approach, continuous learning, and effective risk management.
FAQ’S
Answer: Technical analysis is a stock market method that studies past price movements, charts, and trading volume to predict future price trends and identify buying and selling opportunities.
Answer: Fundamental analysis evaluates a stock’s financial health, business performance, and economic factors, while technical analysis focuses on price charts, patterns, and indicators to predict future market movements.
Answer: Yes, technical analysis is highly useful for short term trading because it helps traders to analyze price patterns, trends, volume, and indicators to identify quick entry and exit points with better timing and risk management.
Answer: Candlestick patterns are visual chart formations used in technical analysis to understand price movements and predict possible future trends in the stock market.
Answer: Trendlines are used by connecting higher lows in an uptrend or lower highs in a downtrend to identify the market trend, support & resistance levels, and potential entry or exit points in technical analysis.
Disclaimer
This article is for educational and informational purposes only and should not be considered financial, investment, trading, legal, or tax advice. Cryptocurrency, blockchain, stock markets, and other financial investments involve risks. Always conduct your own research and consult a qualified financial advisor before making any investment decisions.